“You cannot improve what you cannot measure,” said the famous mathematician and physicist Lord William Thomson Kelvin, and he was absolutely right.
In fact, when it comes to lead generation, it is very easy to get to a point where it seems that no effort leads to improvement.
This is because it is a strategic and articulated process composed of several stages. Improving a lead generation process means first clearly understanding what the various touch points are with the lead (or potential customer) and providing, for each of these moments, a clear and precise measurement.
When it comes to lead generation, however, not all metrics are equal. Some are deeper, more cross-cutting and strategic than others.
For example, the infamous CTR is a very superficial metric. It can be evaluated to understand the effectiveness in terms of visual and copy of an ad, but it can also prove to be very misleading.
Creating extremely aggressive copy may improve the CTR, but lower the quality of my leads at the same time.
CPC (Cost Per Click) is equally misleading. I might prefer ads that get a low CPC but, in doing so, I might end up favoring ads that cost little because they serve a “low value” audience, on which there is little competition (and therefore the auction between advertisers does not raise the price).
An ad with high CTR and low CPC is everyone’s dream, but this is where you go wrong. It would certainly bring many more users to the landing page, but probably few of them would then be interested in buying. In fact, the audience was poorly targeted and the aggressive (if not clickbait) copy did the rest of the damage.
This path within the funnel to purchase (or buyer’s journey) is what makes a broader and deeper view necessary. A metric such as CPL (Cost Per Lead, which we will look at in a moment) is a better metric because it encompasses and synthesizes the results of several phases, also allowing for a quicker assessment of the quality of a campaign.
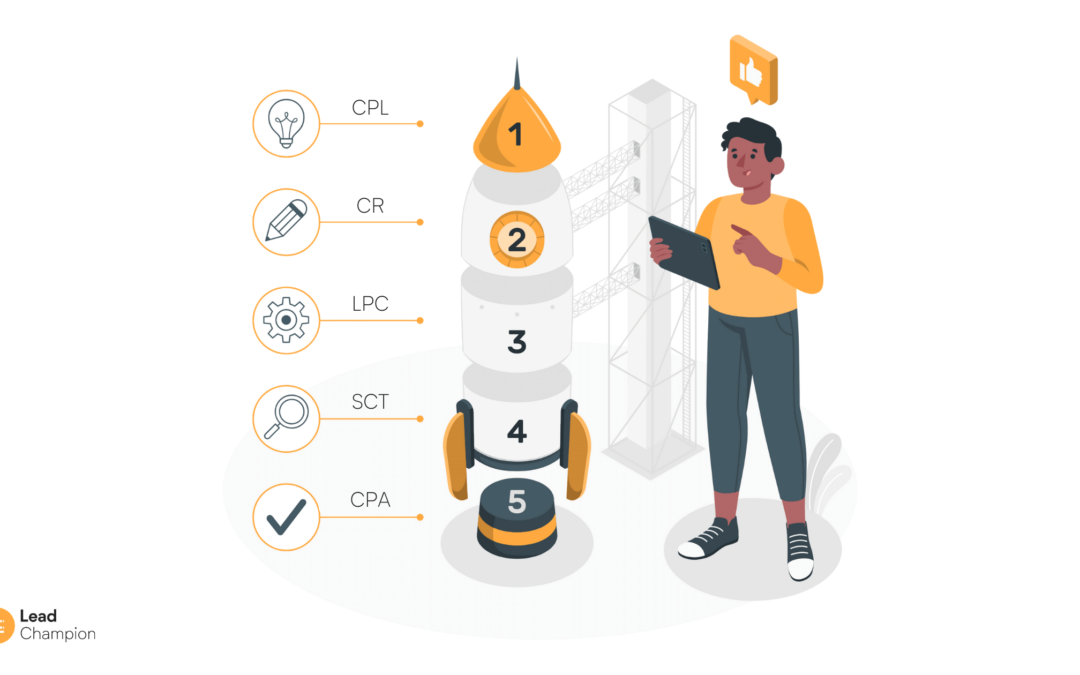
5 Lead Generation metrics you should know
In this article we will take a look at the metrics to consider in a lead generation strategy.
#1 Cost Per Lead (CPL)
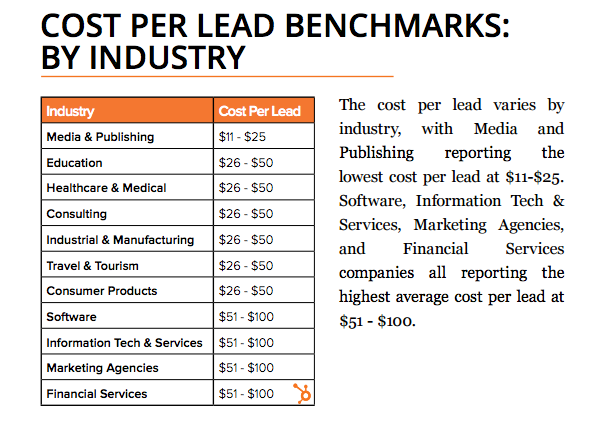
As mentioned earlier, CPL is one of the most important metrics in lead generation. In fact, it represents how much was spent to acquire each lead. It can vary greatly from industry to industry.
Find the average CPL by industry here (source Hubspot)
Formula: Cost Per Lead= Campaign Cost/Lead Acquired
#2 Conversion rate
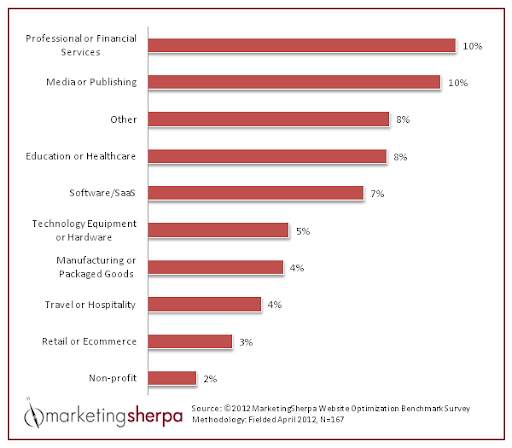
It is very important to keep track of the conversion rate. This is the percentage of users who have converted compared to the total number of visitors. Clearly, for every business and every lead generation strategy, the concept of “conversion” can take on different meanings: downloading an ebook, booking a demo, signing up for a newsletter, etc.
This metric is useful because it allows you to take action from a Conversion Rate Optimization perspective. By increasing the conversion rate of visitors arriving on your landing page you will have an increase in the number of leads for the same cost (since the click on the source ad, if any, has already occurred).
Below is a chart with industry averages (source MarketingSherpa)
#3 Leads per channel
Usually, lead generation campaigns involve several channels. Therefore, it is important to keep track of what the performance of each is. This metric serves to always have a quick overview at hand of which channels make the most sense to invest budget in.
This way you can eventually shift budget from the less productive channels to those that provide the greatest returns.
Some software, such as Lead Champion discover. shows you from which channel (and possibly which specific campaign) brought leads to your site, allowing you to analyze the data accurately and efficiently: this way you can get a qualitative view of traffic for each channel, assessing how close your visitors are to your ideal customer
Salesforce reports an interesting analysis showing that, unexpectedly, one of the most effective channels turned out to be referrals through employees and customers.
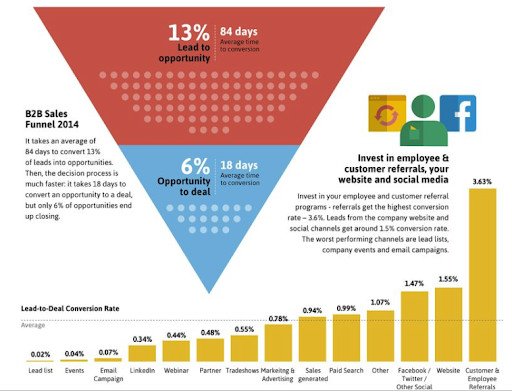
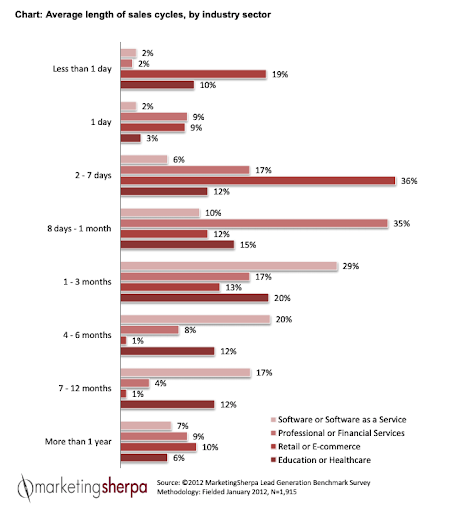
#4 Sales Cycle Time
A much underestimated metric is Sales Cycle Time. It indicates the average time it takes for a lead to turn into a customer. Calculating this time frame allows you to be able to make more realistic predictions about the results you can get from each campaign. Clearly, the goal should be to reduce the Sales Cycle Time to get to a faster close
As you see from this MarketingSherpa infographic, the data varies greatly based on industry.
To calculate Sales Cycle Time, you need to calculate how much time elapsed from first contact (typically the date the lead was created on CRM) until closing, for all your customers (or those in the last year for a more contextual analysis) and average it.
#5 Cost Per Acquisition
Cost per Acquisition measures how much it costs your business to acquire a new customer.
To understand the effectiveness of a campaign you need to know the average time to close your business, which in B2B can take several months (if on average in your industry it takes 3 months to acquire a customer, it would not make sense to do analysis limited to a 2-week time frame).
With this time window in mind, you can collect spend data by relating it to the number of customers acquired. Based on the average time to close your business.
Formula: CPA= Costs / Customers Acquired
Keep track of your results
We have seen some important lead generation metrics: CPL, Conversion Rate, Leads per channel, Sales Cycle Time and Cost per Acquisition.
There are many other metrics. What we recommend is that you and your team define which ones are essential for your business, and keep track of them at all times, preferably with a shared dashboard, either with Google Data Studio tools or a simple Google Sheet.
Get new leads
from your site with
Lead Champion!
Discover the companies that visit
your products and services.
Start now your free demo
of Lead Champion discover:
